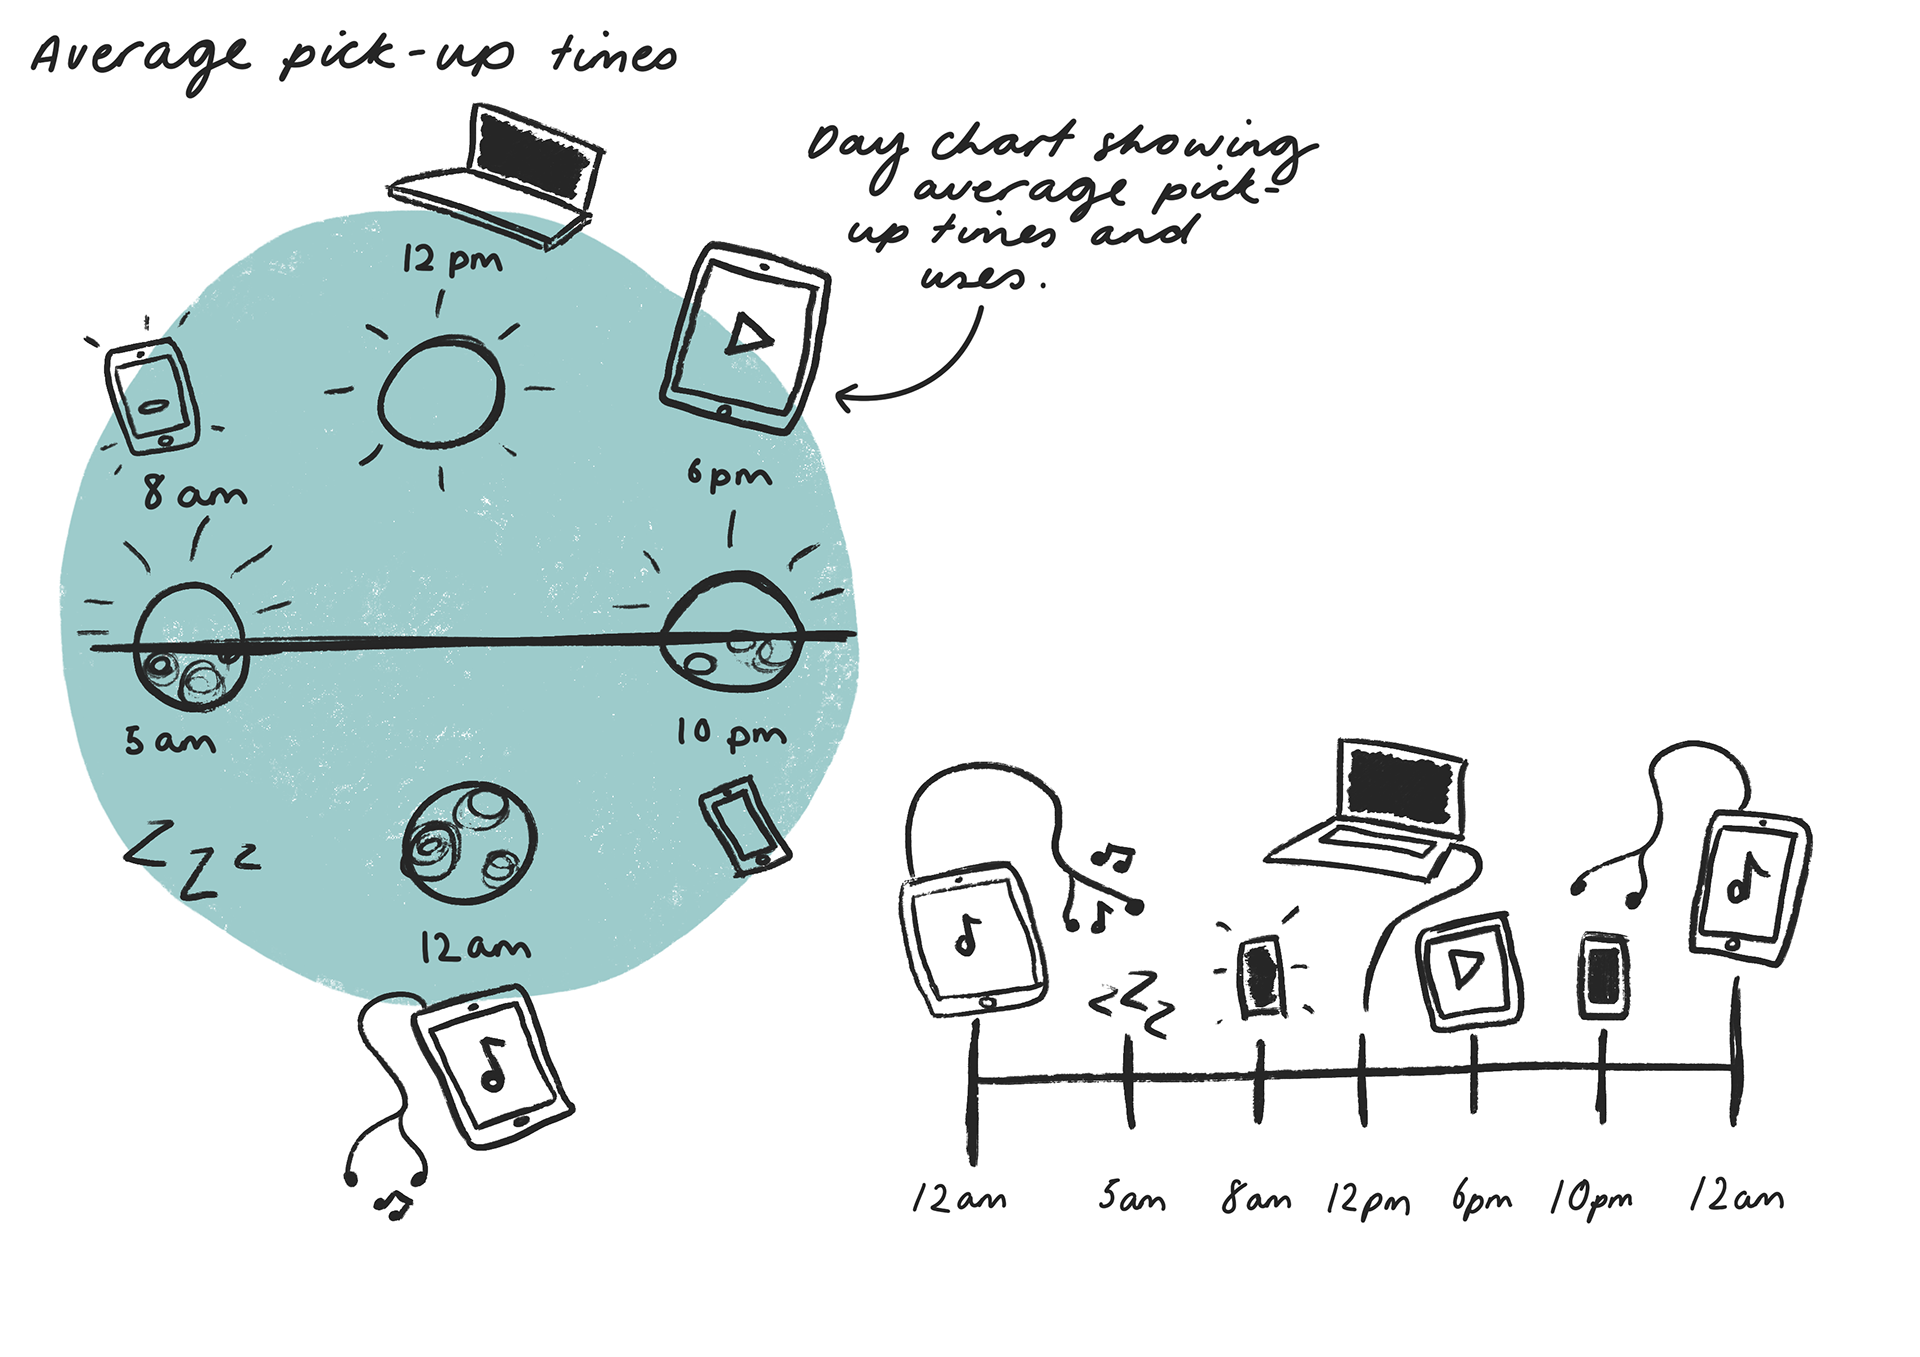
With information graphics becoming largely integrated into how information is presented, this brief asked me to create a visualisation of my own collected data. With the pandemic hitting during this project, I didn't have many options in terms of primary data collection, so I decided to record my own screen time during one week of the initial lockdown and noting what the uses were during different times.
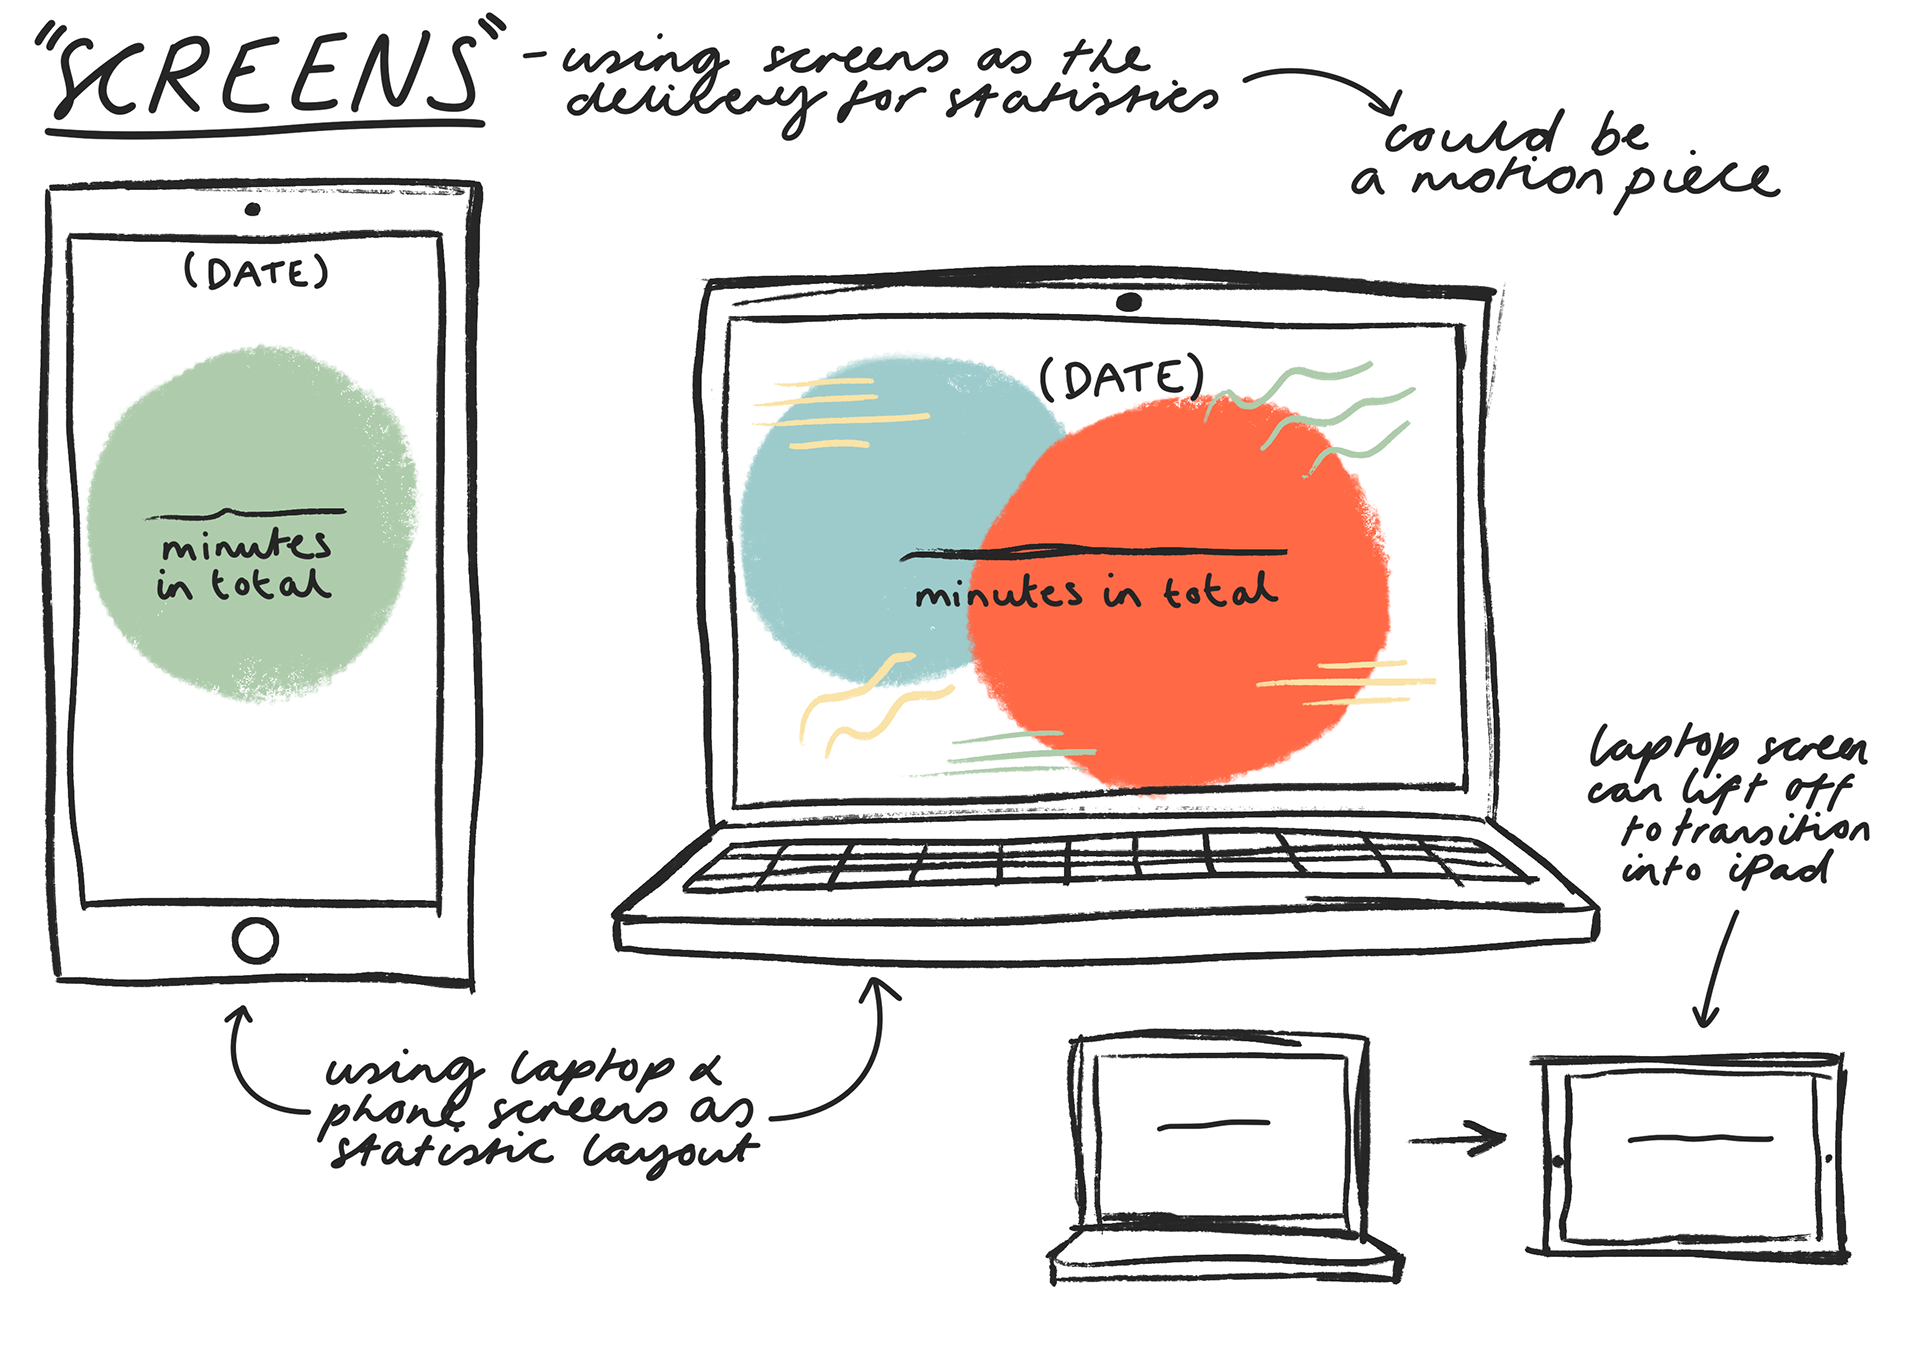
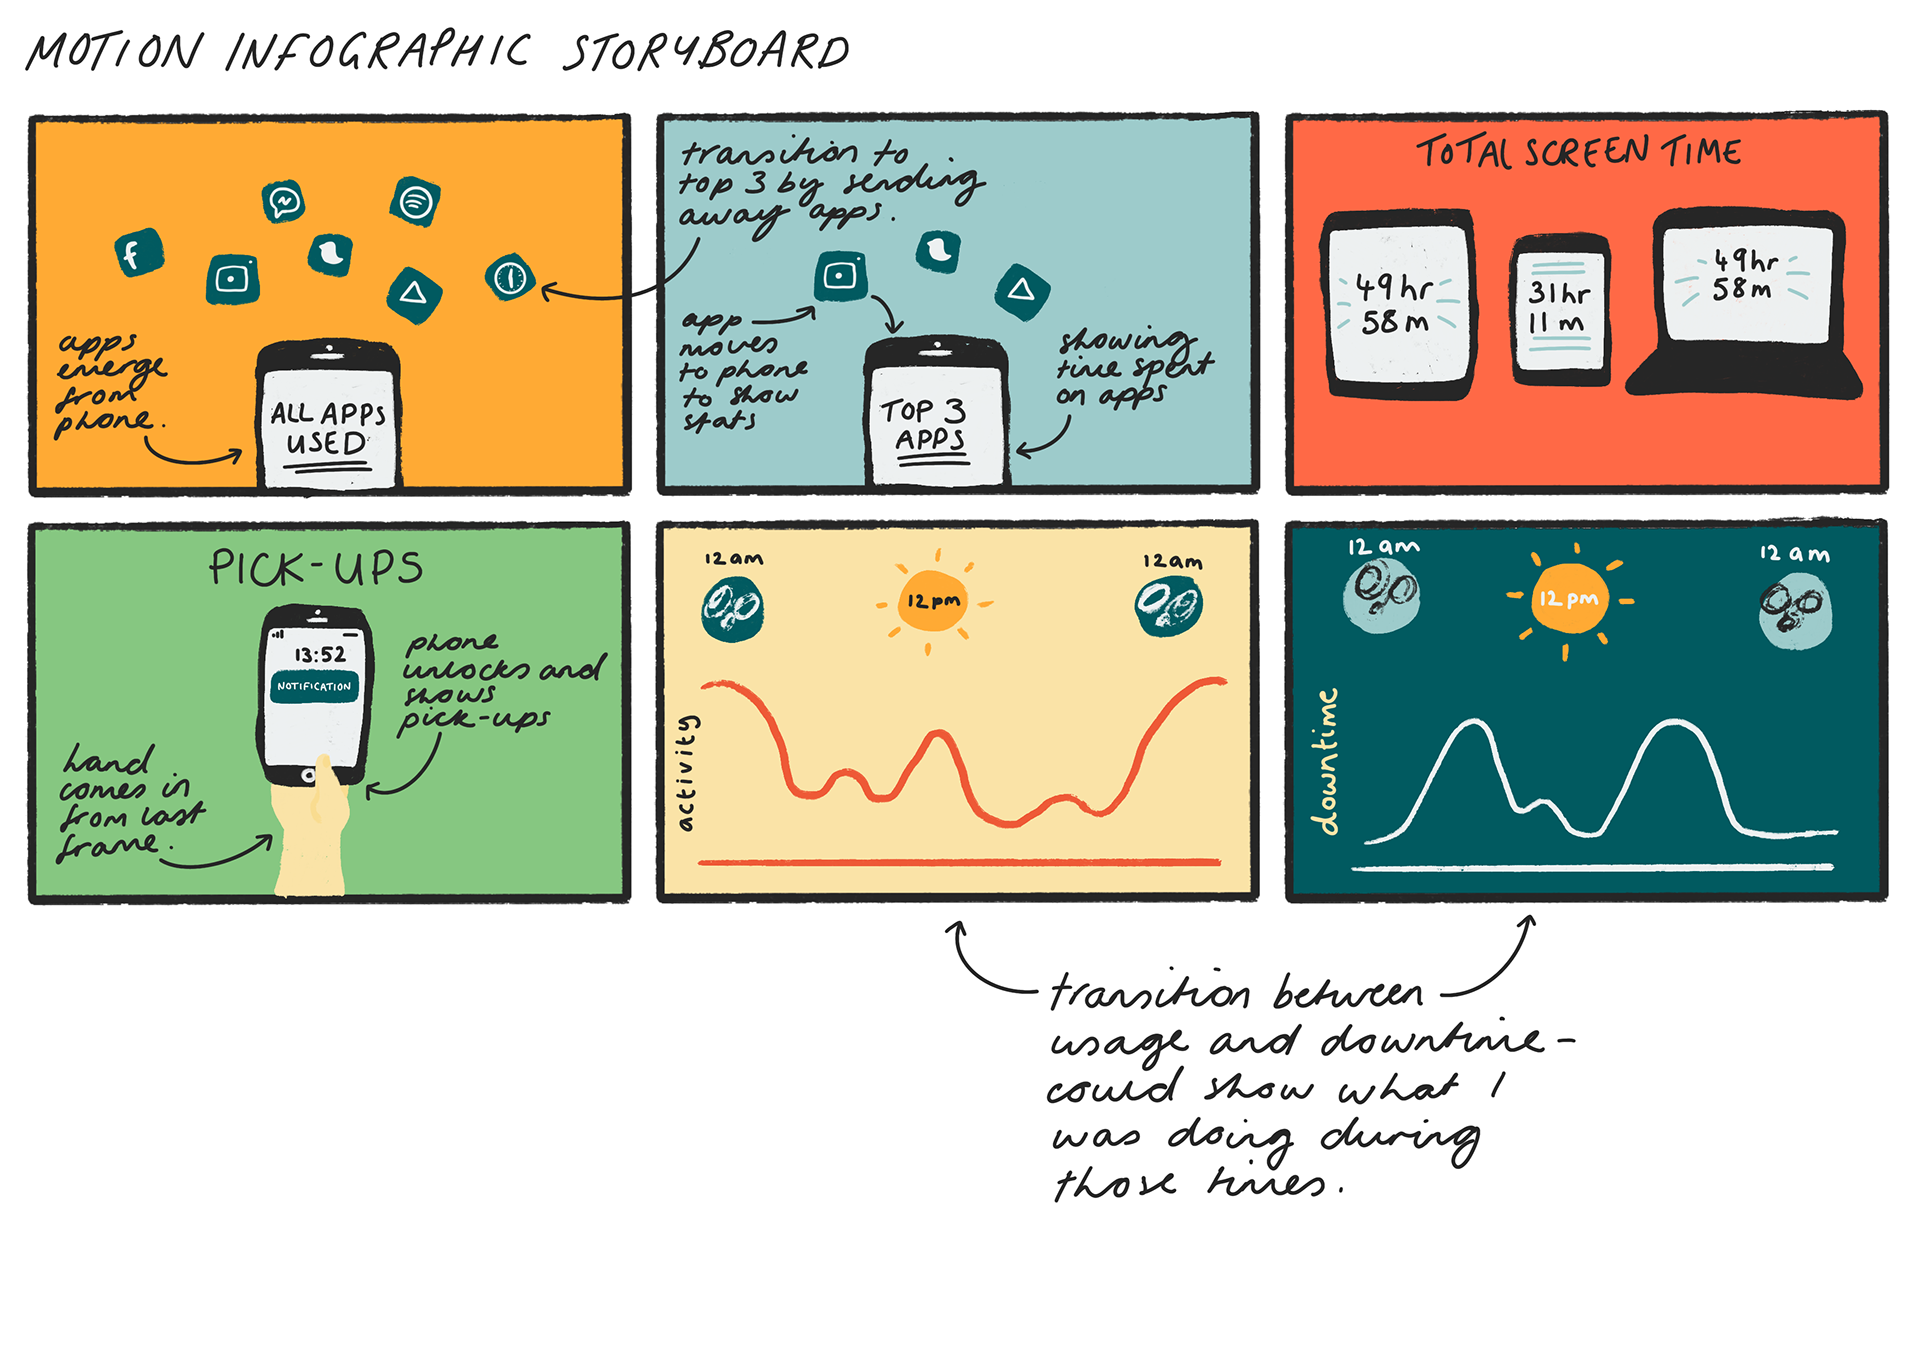
For the making of my outcome, I knew I wanted to create a motion piece as I felt it would be more visually engaging and it would give me an opportunity to get more practice in motion.
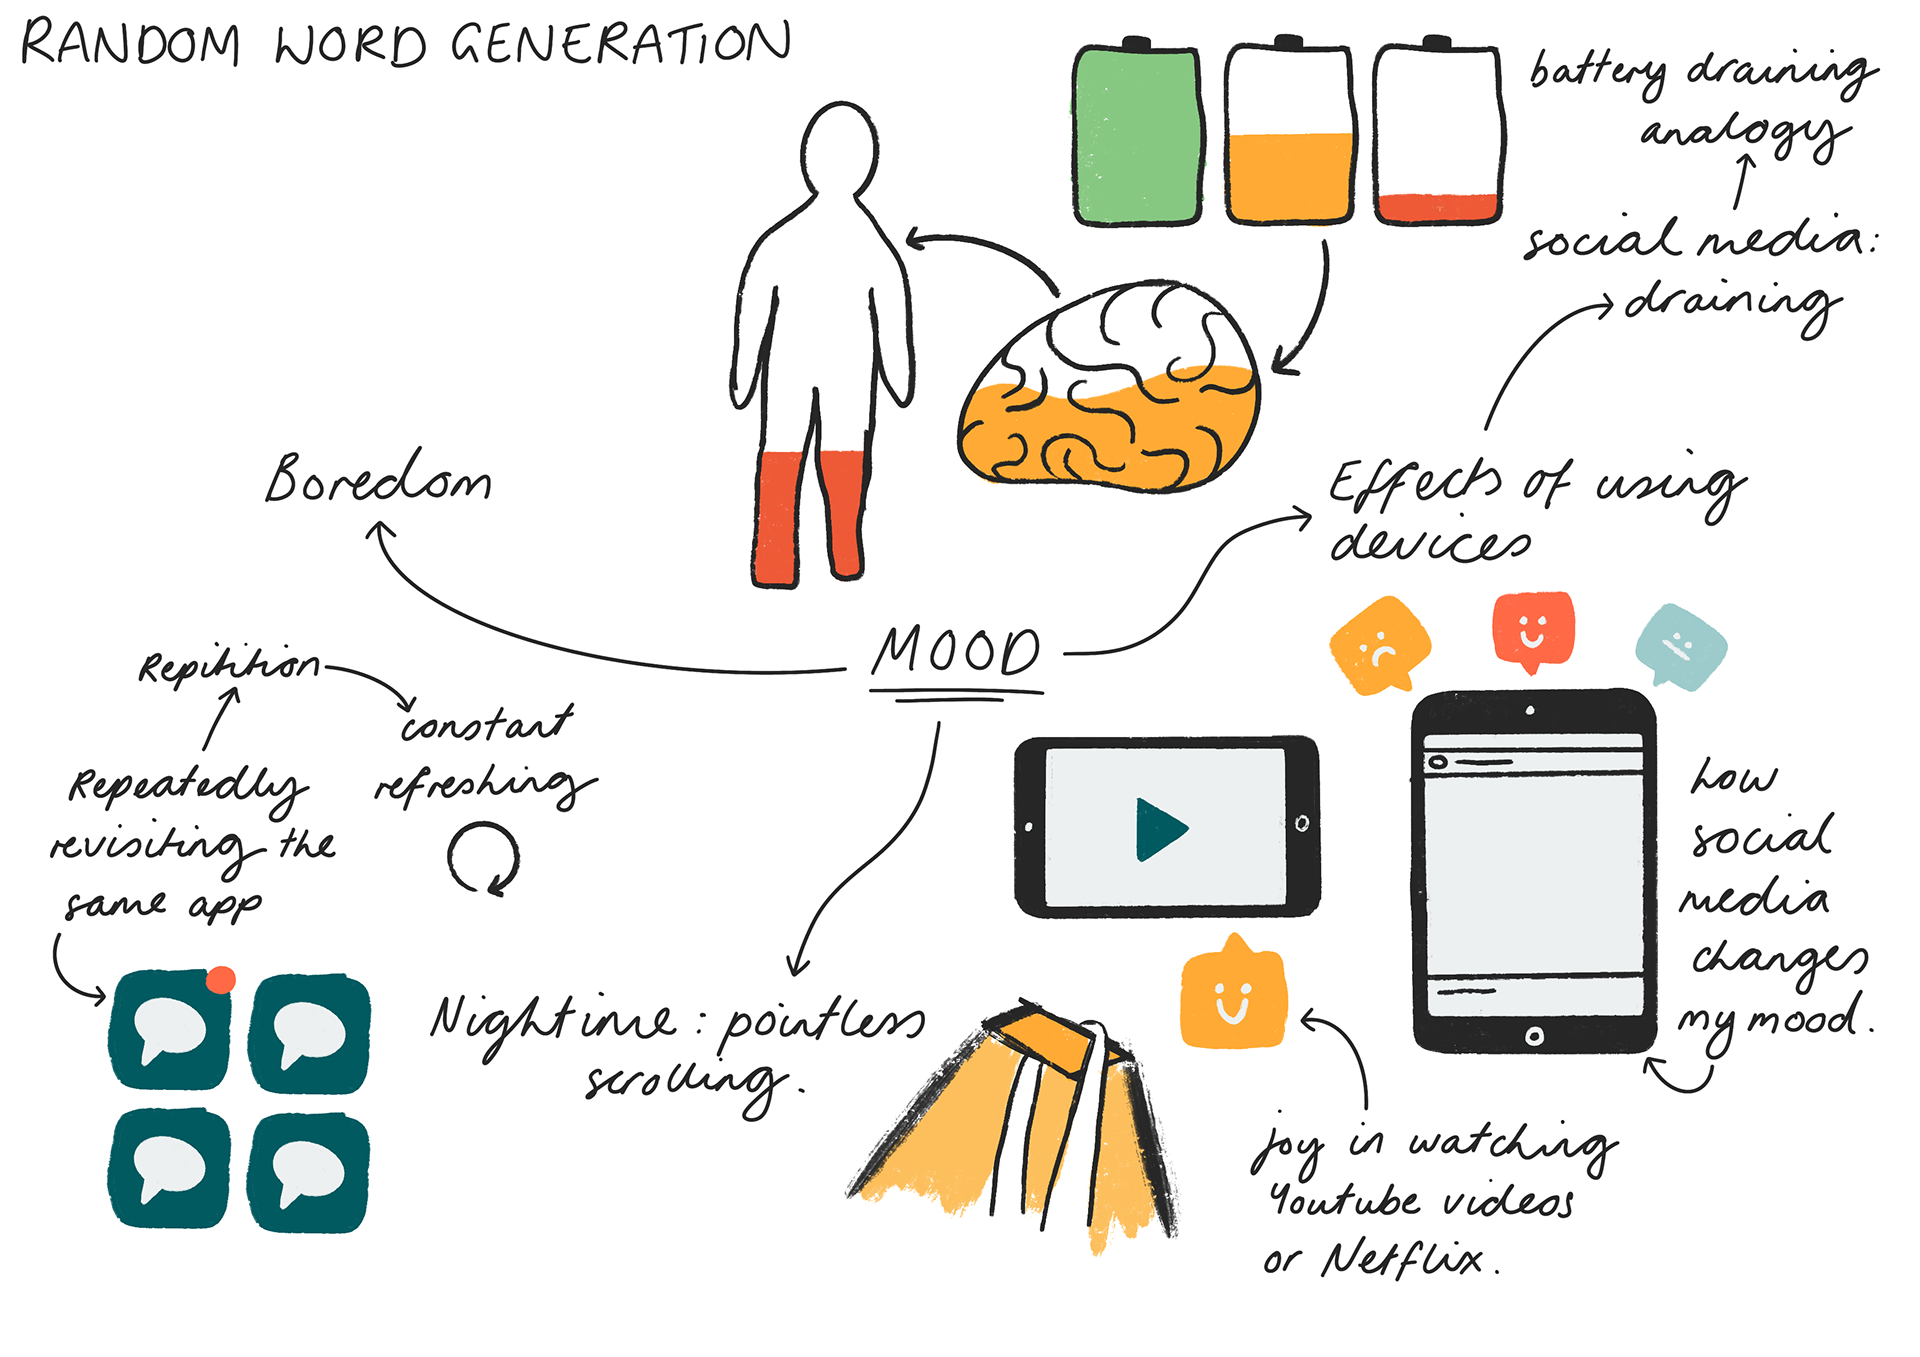
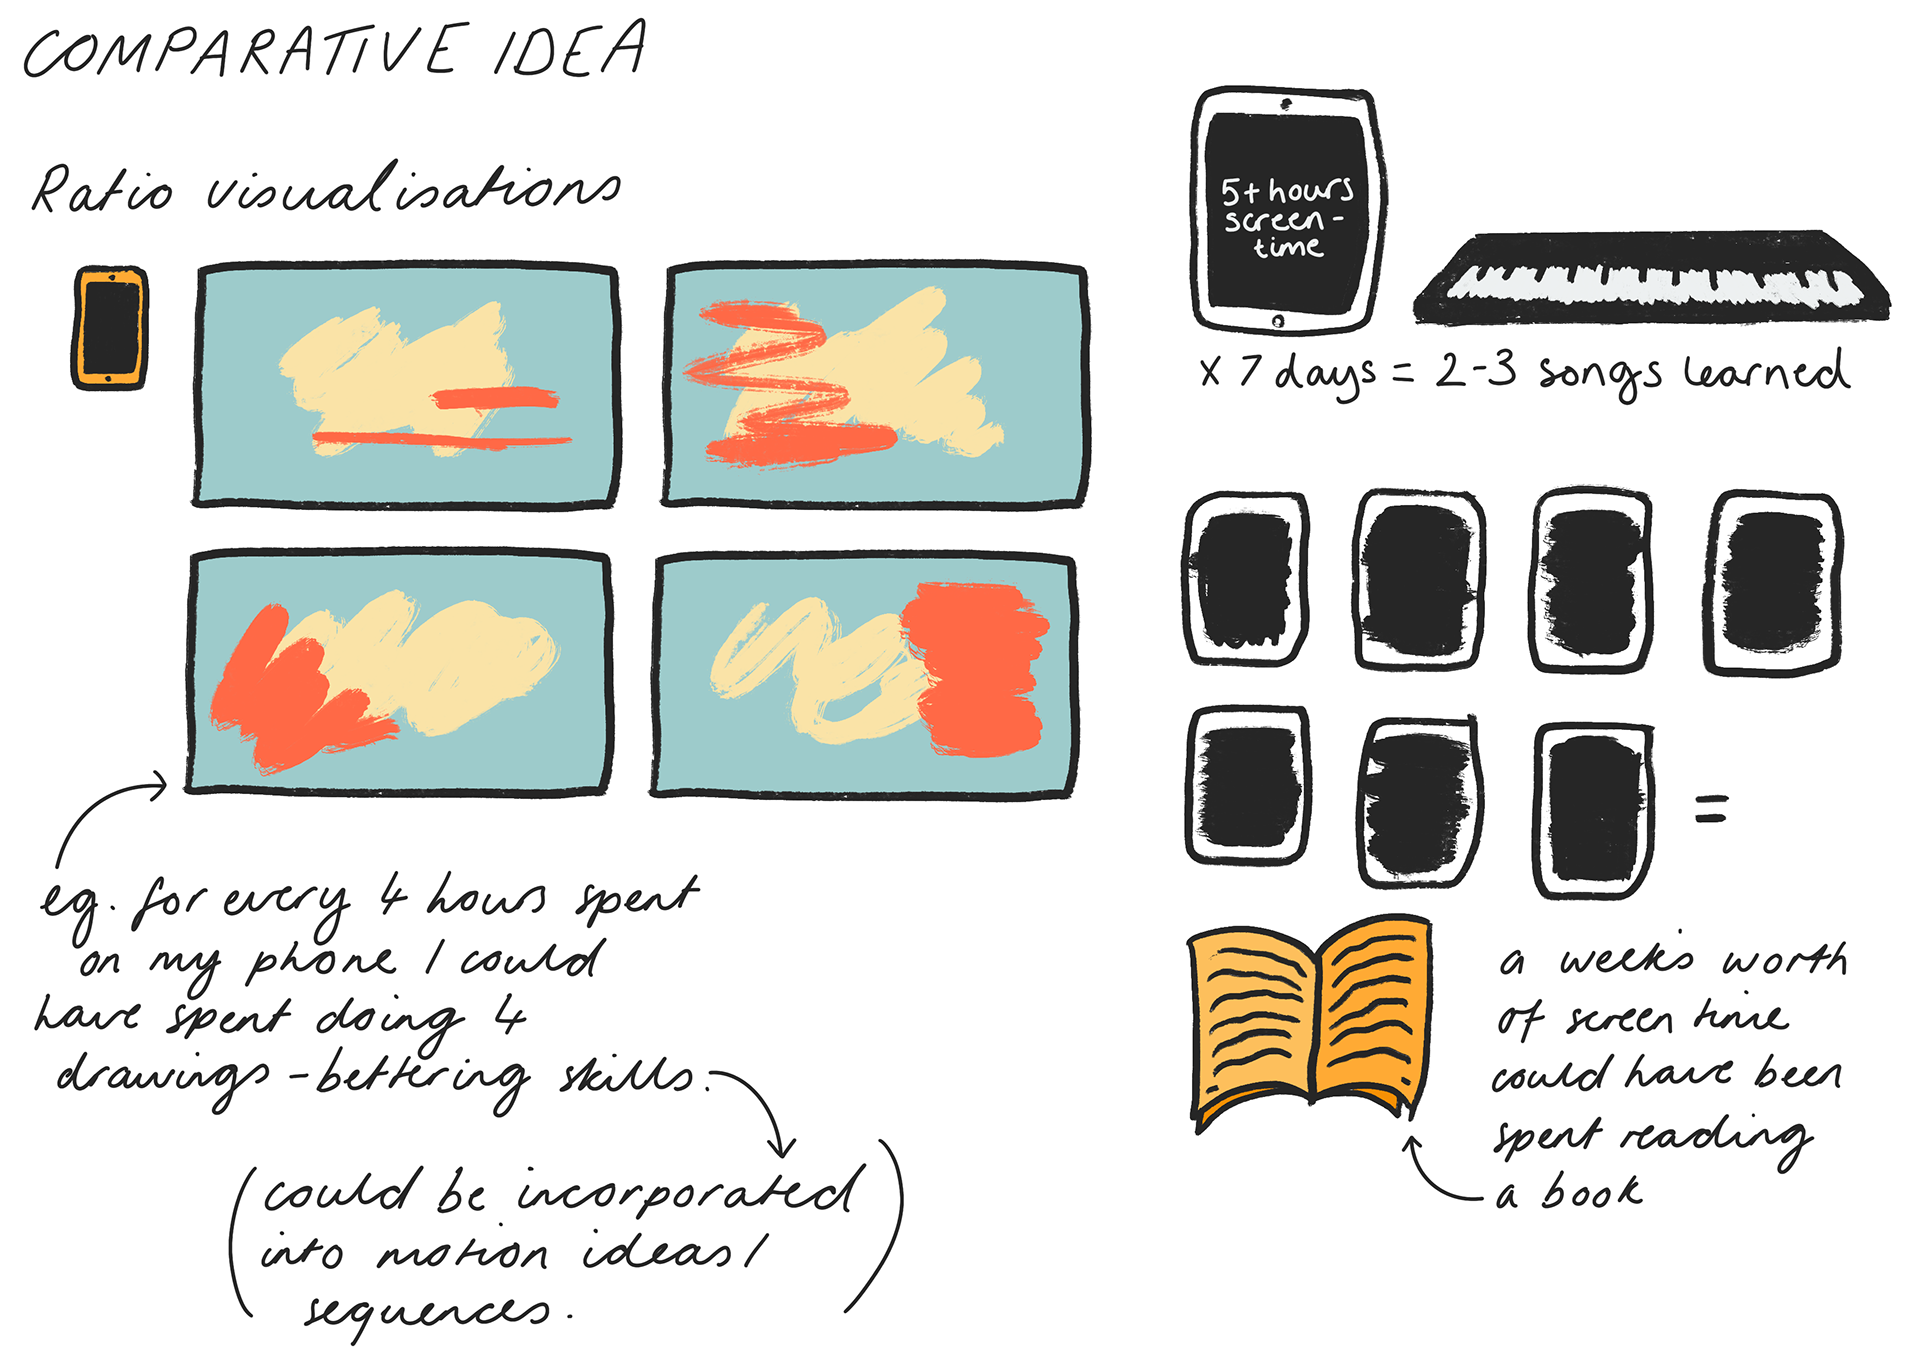
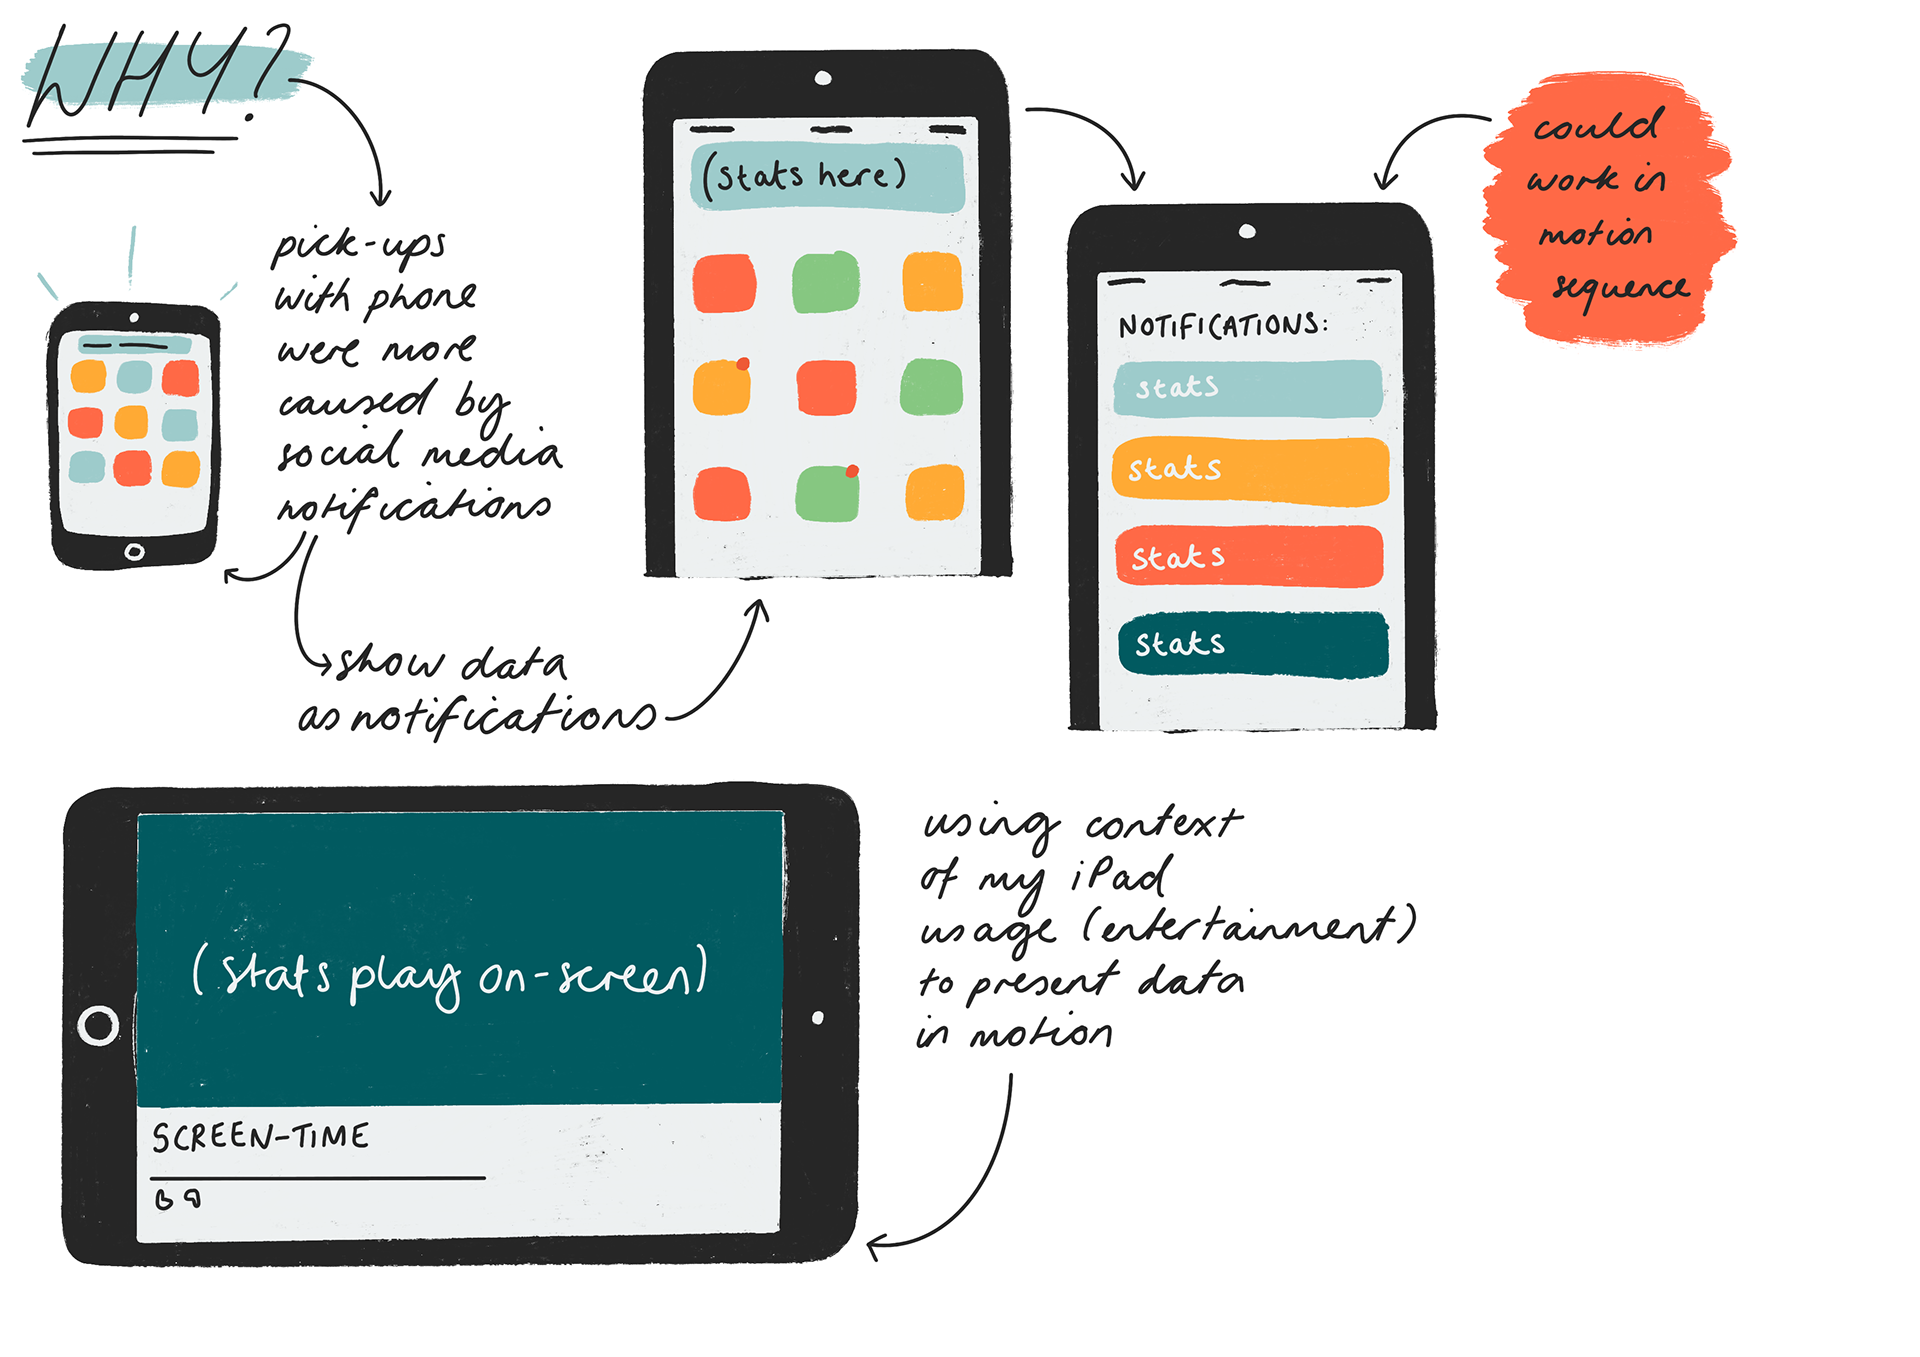
Sketchbook ideation pages